
Water Quality
Total Dissolved Solids—TDS
 If you ever had a family member diagnosed with a serious illness but ultimately declared "healed", then you will understand the joy and celebration at the Kings River Watershed Partnership. Our own, much-loved Kings River has been removed from the Arkansas Department of Environmental Quality list of impaired waterways. It is known as the 303d list and for ten years, ADEQ has reported that the level of Total Dissolved Solids (TDS) in the Kings River exceeded their acceptable threshold. More on water quality regulations.
So what are these tiny particles dissolved in the river that we can't see, how did they get there, and why do they matter?
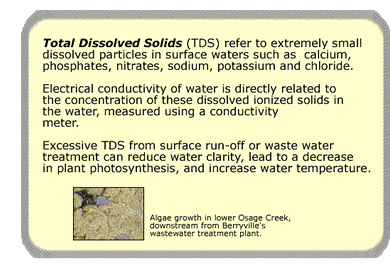
These small bits of calcium, phosphates, nitrates, sodium, potassium and chloride typically enter the stream from surface run-off: as rain moves across fields, through ditches, drains from parking lots and lawns, entering small streams that flow into the Kings River. They also are found in wastewater discharged from sewage treatment plants and from private home septic systems. Excessive amounts of TDS can reduce water clarity, lead to a decrease in plant photosynthesis, and increase water temperature. Changes like this affect whatever is living and swimming in the water, from small insect larva cruising the gravel in the stream bottom (what small mouth bass would call dinner) to crawdads and plant life. More on macroinvertebrates.
Volunteers from the Kings River Watershed Partnership, led by board member Ray Warren, have routinely sampled the water in the river for over a decade at multiple points on a 50 mile stretch and accumulated a battery of data. Testing begins near Kingston in the upper reaches of the Kings. A test site is upstream of the confluence with the Osage Creek, and another at Stoney Point before the river flows on to Table Rock Lake. The quality of Osage Creek is measured upstream of Berryville and then downstream of the City before it merges with the Kings.
KRWP water monitors measure the amount of TDS using an electrical conductivity meter. Laboratories can measure with a more complex method. Water samples are transferred to a calibrated dish which is put into an oven and heated at 350 degrees F until all the water has boiled off. Careful weighing of the dish before and after the time in the oven will reveal the amount of solid material that was in the water sample.
While ADEQ has determined that the Upper Kings River is no longer classified as impaired, such is not the case for water quality below the Highway 62 Bridge and flowing toward Table Rock Lake in Missouri. The TDS figures are still high in this downstream region since water run-off from residential or commercial areas will inevitably increase contaminants. Berryville and adjacent rural areas drain into the lower Kings River.
It was no surprise to the testers that results varied widely, depending on the river level, time of day, and season. This is why water samples are collected at intervals throughout the year, over a number of years. While ADEQ has determined that the Upper Kings River is no longer classified as impaired, such is not the case for water quality below the Highway 62 Bridge and flowing toward Table Rock Lake in Missouri. The TDS figures are still high in this down stream region since water run-off from residential or commercial areas will inevitably increase contaminants. Berryville and adjacent rural areas drain into the lower Kings River. During flood conditions the clarity of water (turbidity) deteriorates as mud and gravel wash from eroded banks and from county roads. When the water level drops to a trickle in the summer heat, turbidity improves, but the TDS readings worsen.
Judgement of impaired status can be as murky as the river in flood. How many tests, at what locations, over what period of time? Can the ruling be challenged? The answer that KRWP believes to be effective involves meticulous testing to a high degree of scientific accuracy, over a long period of time and supplying the test results to ADEQ. The staff at ADEQ could then compare KRWP data against their own figures and act accordingly.
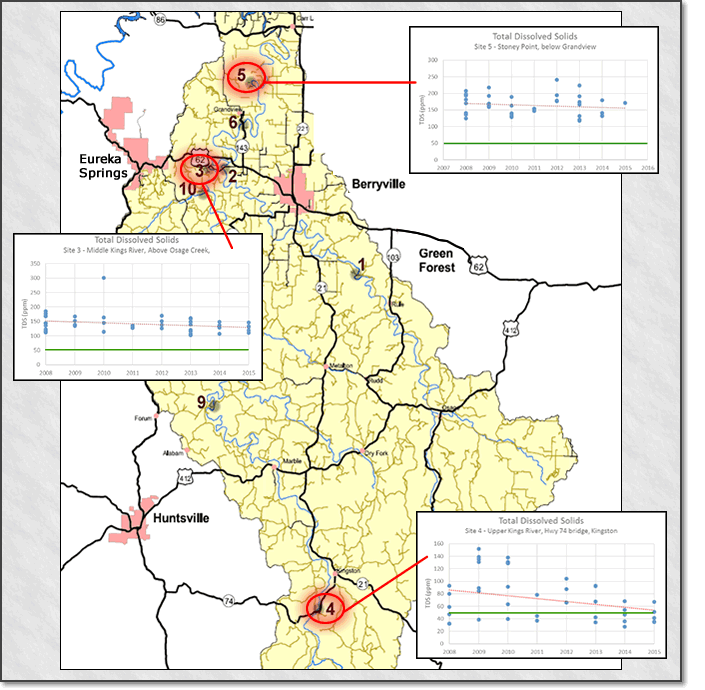
TDS Data Summary 2008-2015
- Each blue dot, stacked up vertically, is a single TDS sample taken during that year, at that site.
- Each graph at the left shows a dotted red line, which is the trend in the amount of TDS, measured in parts per million (ppm) at that site for the entire 8-year period of testing.
- The green line is the limit for impaired water status, 50 ppm.
- Notice that the trend line is downward at the three testing sites, but flatter at sites #3 and #5.
- TDS increases as you move downstream (from the bottom of the map toward the top) from site #4 above Kingston to site #3 above the Osage Creek confluence and onto site #5 at Stoney Point. Of course, increasing contributions of volumes of water by tributaries occur as you move down stream, as well as runoff from land surfaces along the river.
P.O. Box 961 | Berryville, AR 72616 | Phone: 870-480-8897 | Email: KRWP@kingsriverwatershed.org
Site Copyright © Kings River Watershed Partnership 2007-2023. All rights reserved.
Last Update April 2023
